Introduction to Exponential Random Graph Models
We begin our workshop by providing a conceptual overview of what exponential random graph models (ERGMs) are and what they do.
Table of contents
Statistically Modelling Relational Systems
Our task is to study a set of relational outcomes that’s part of a social or political (or other) system.
- hypothesis testing
- outcome prediction
What are relational systems?
An interdependent set of relationships/interactions among units in a system.
- conflict among states or other actors in the international system
- collaboration among policy actors in a region, country, or the world
- citations between academic papers or judicial court cases
- friendship, influence, and learning among students in a classroom
We can understand and represent these systems as networks
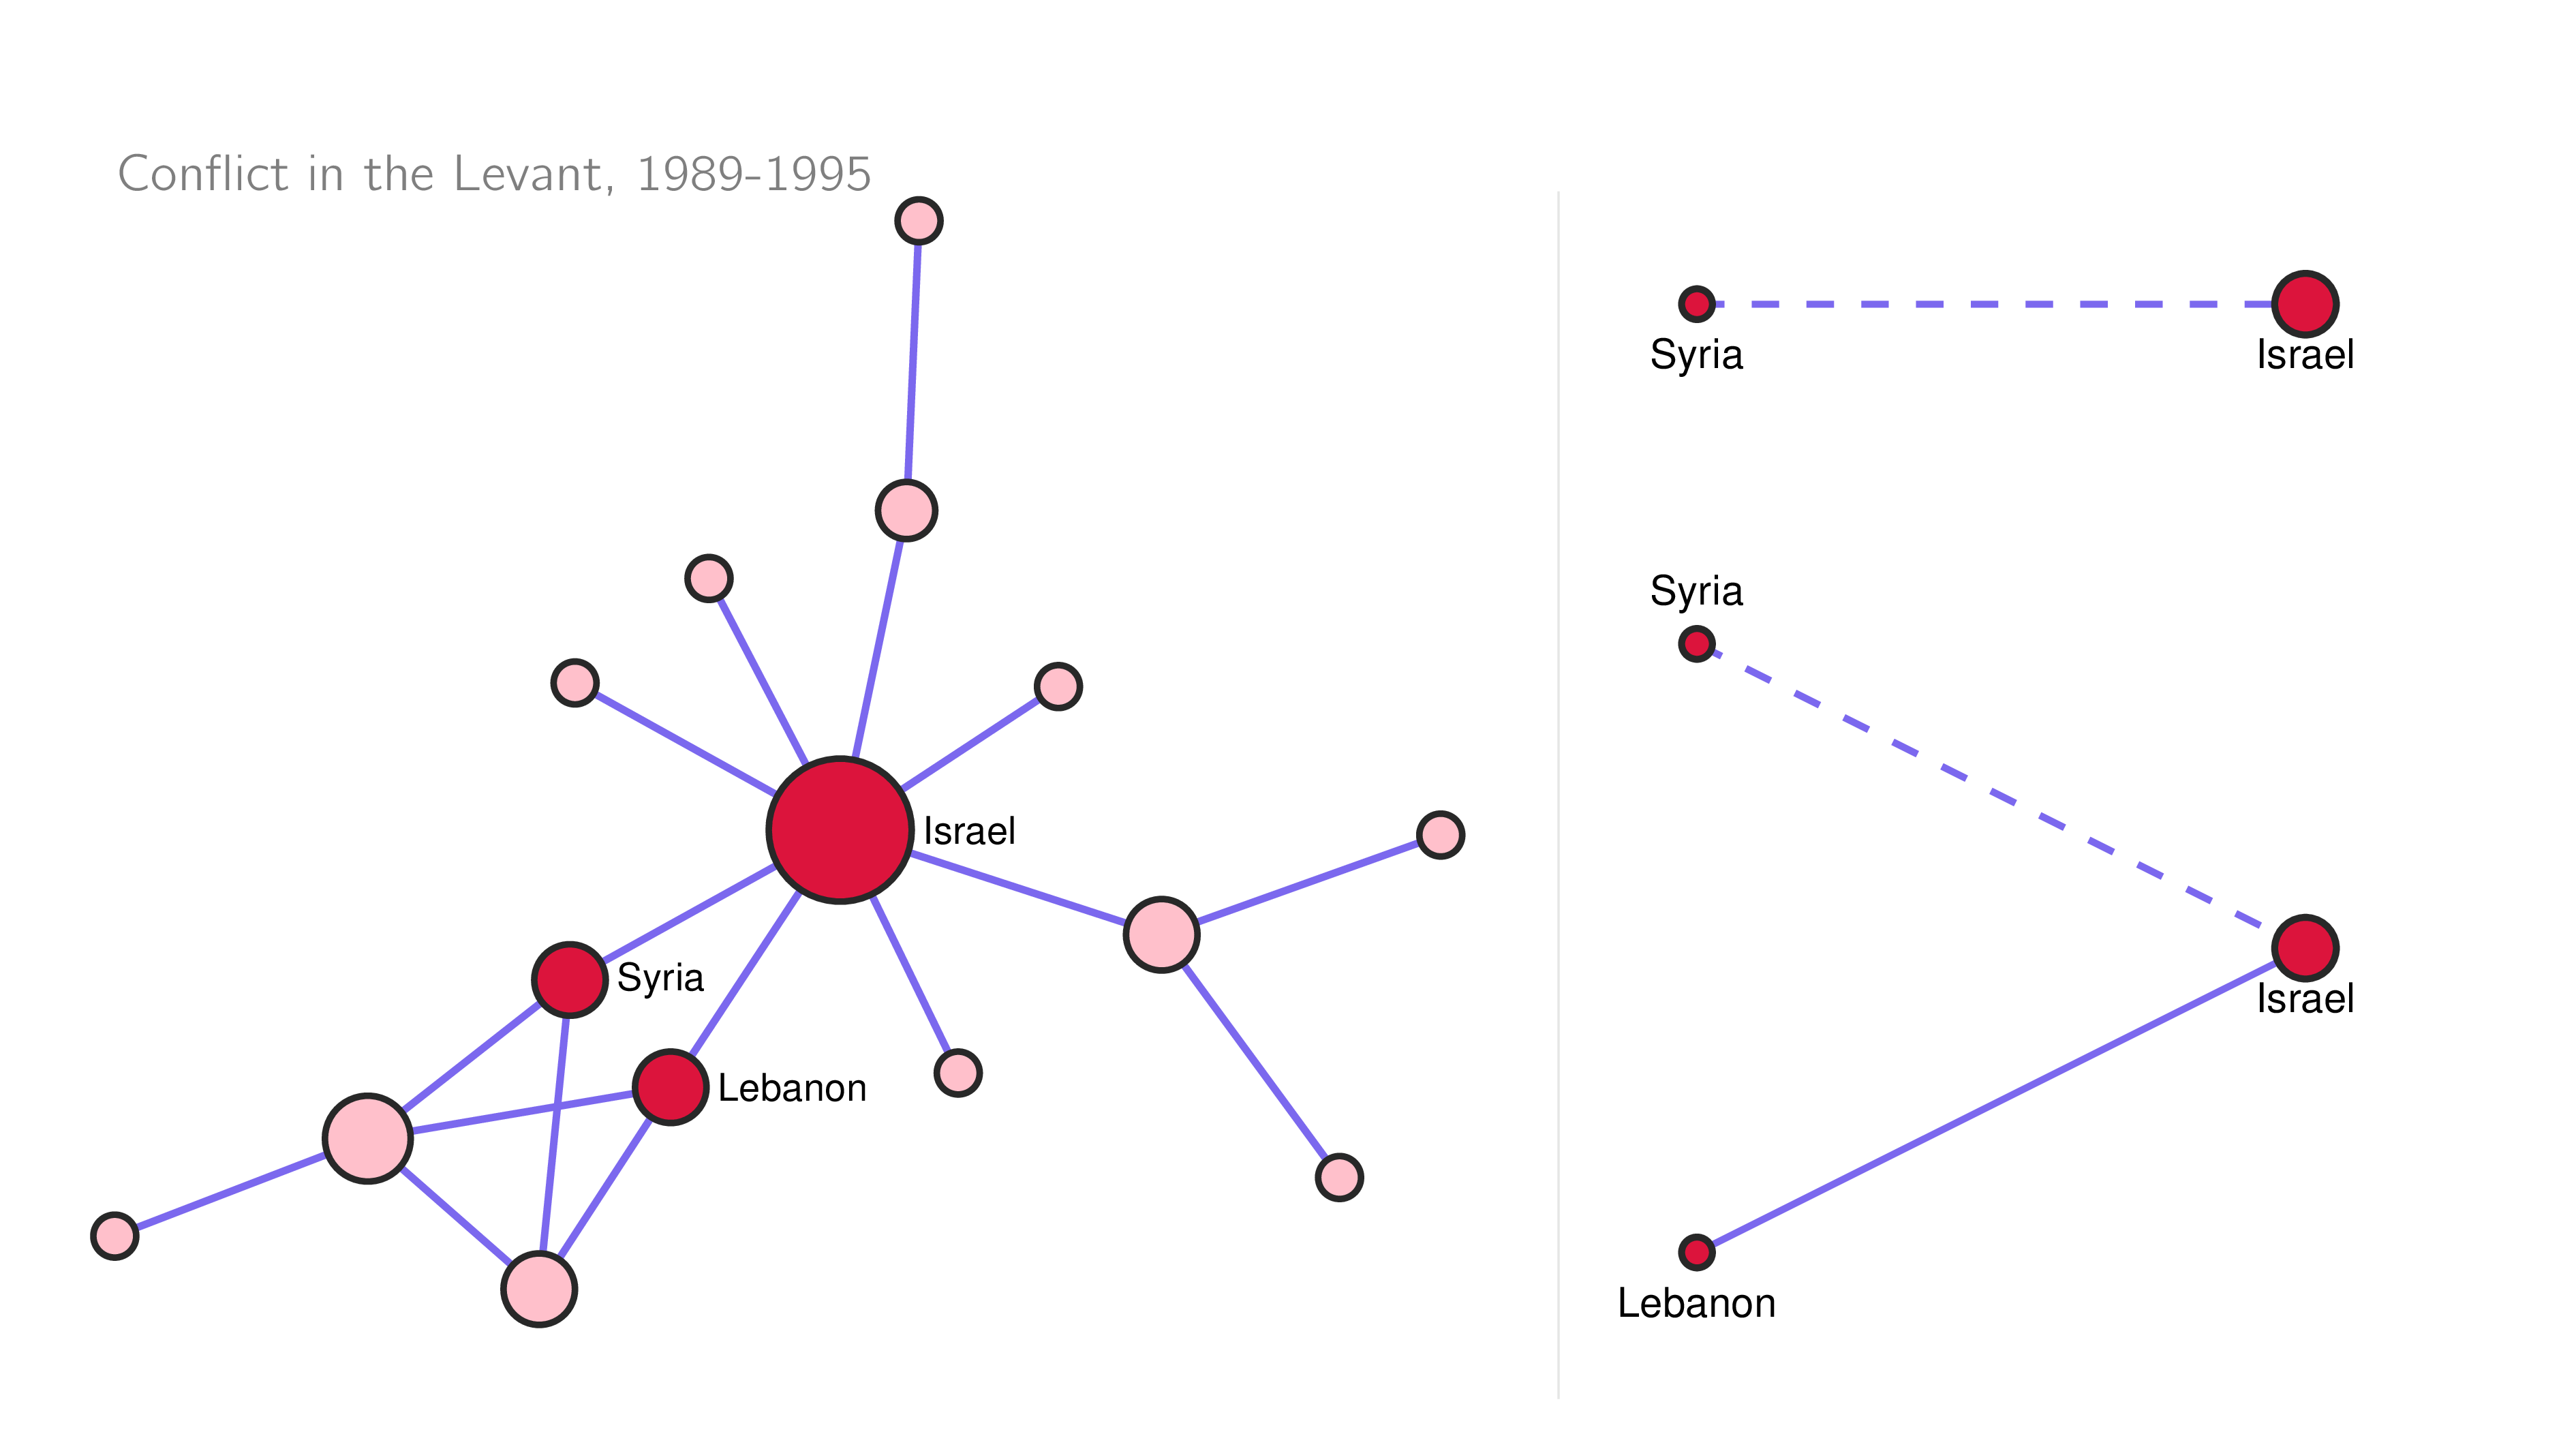
This is a simple network plot of some conflicting actors in the post-Cold War Levant region.

How would we begin to analyze this system? What predicts conflict tie formation?
Let’s use Israel and Syria as an example:
- geographical proximity
- history of conflict
- mixed regime dyad
But what about the role of Lebanon in all this?
Units in relational systems are rarely independent
Think about the concept of preferential attachment:
- ties are more likely to form where there are already ties
- in conflict studies, this is sometimes called the “pile-on” effect (e.g. sanctions)
- it becomes less costly to attack/sanction a target when others are already doing it
- when the ties are positive, this is sometimes called the popularity effect (esp. when ties are directed inwards)
- preferential attachment is just one example of this kind of interdependence
What happens if we analyze this kind of data with classical regression methods?
Think in terms of the logistic regression.
- what are the variables we can put into the model?
- Everything on the dyad (i.e. node- or dyad-level variables)
In this case, the predictors is a vector of unit-level (i.e. dyad/directed dyad) variables.
- We are missing parts of the data generating process: Omitted variable bias.
- We are not accounting for interdependence: Overrejection from overly small standard errors.
We need a statistical model that can:
- model the interdependence between units in these systems that affect observed outcomes
- account for the lack of independence between units when fitting the model
This brings us to the exponential random graph model.
What are ERGMs?
The exponential random graph model is a family of models used for statistically modelling the generative features of an observed network.
The ERGM
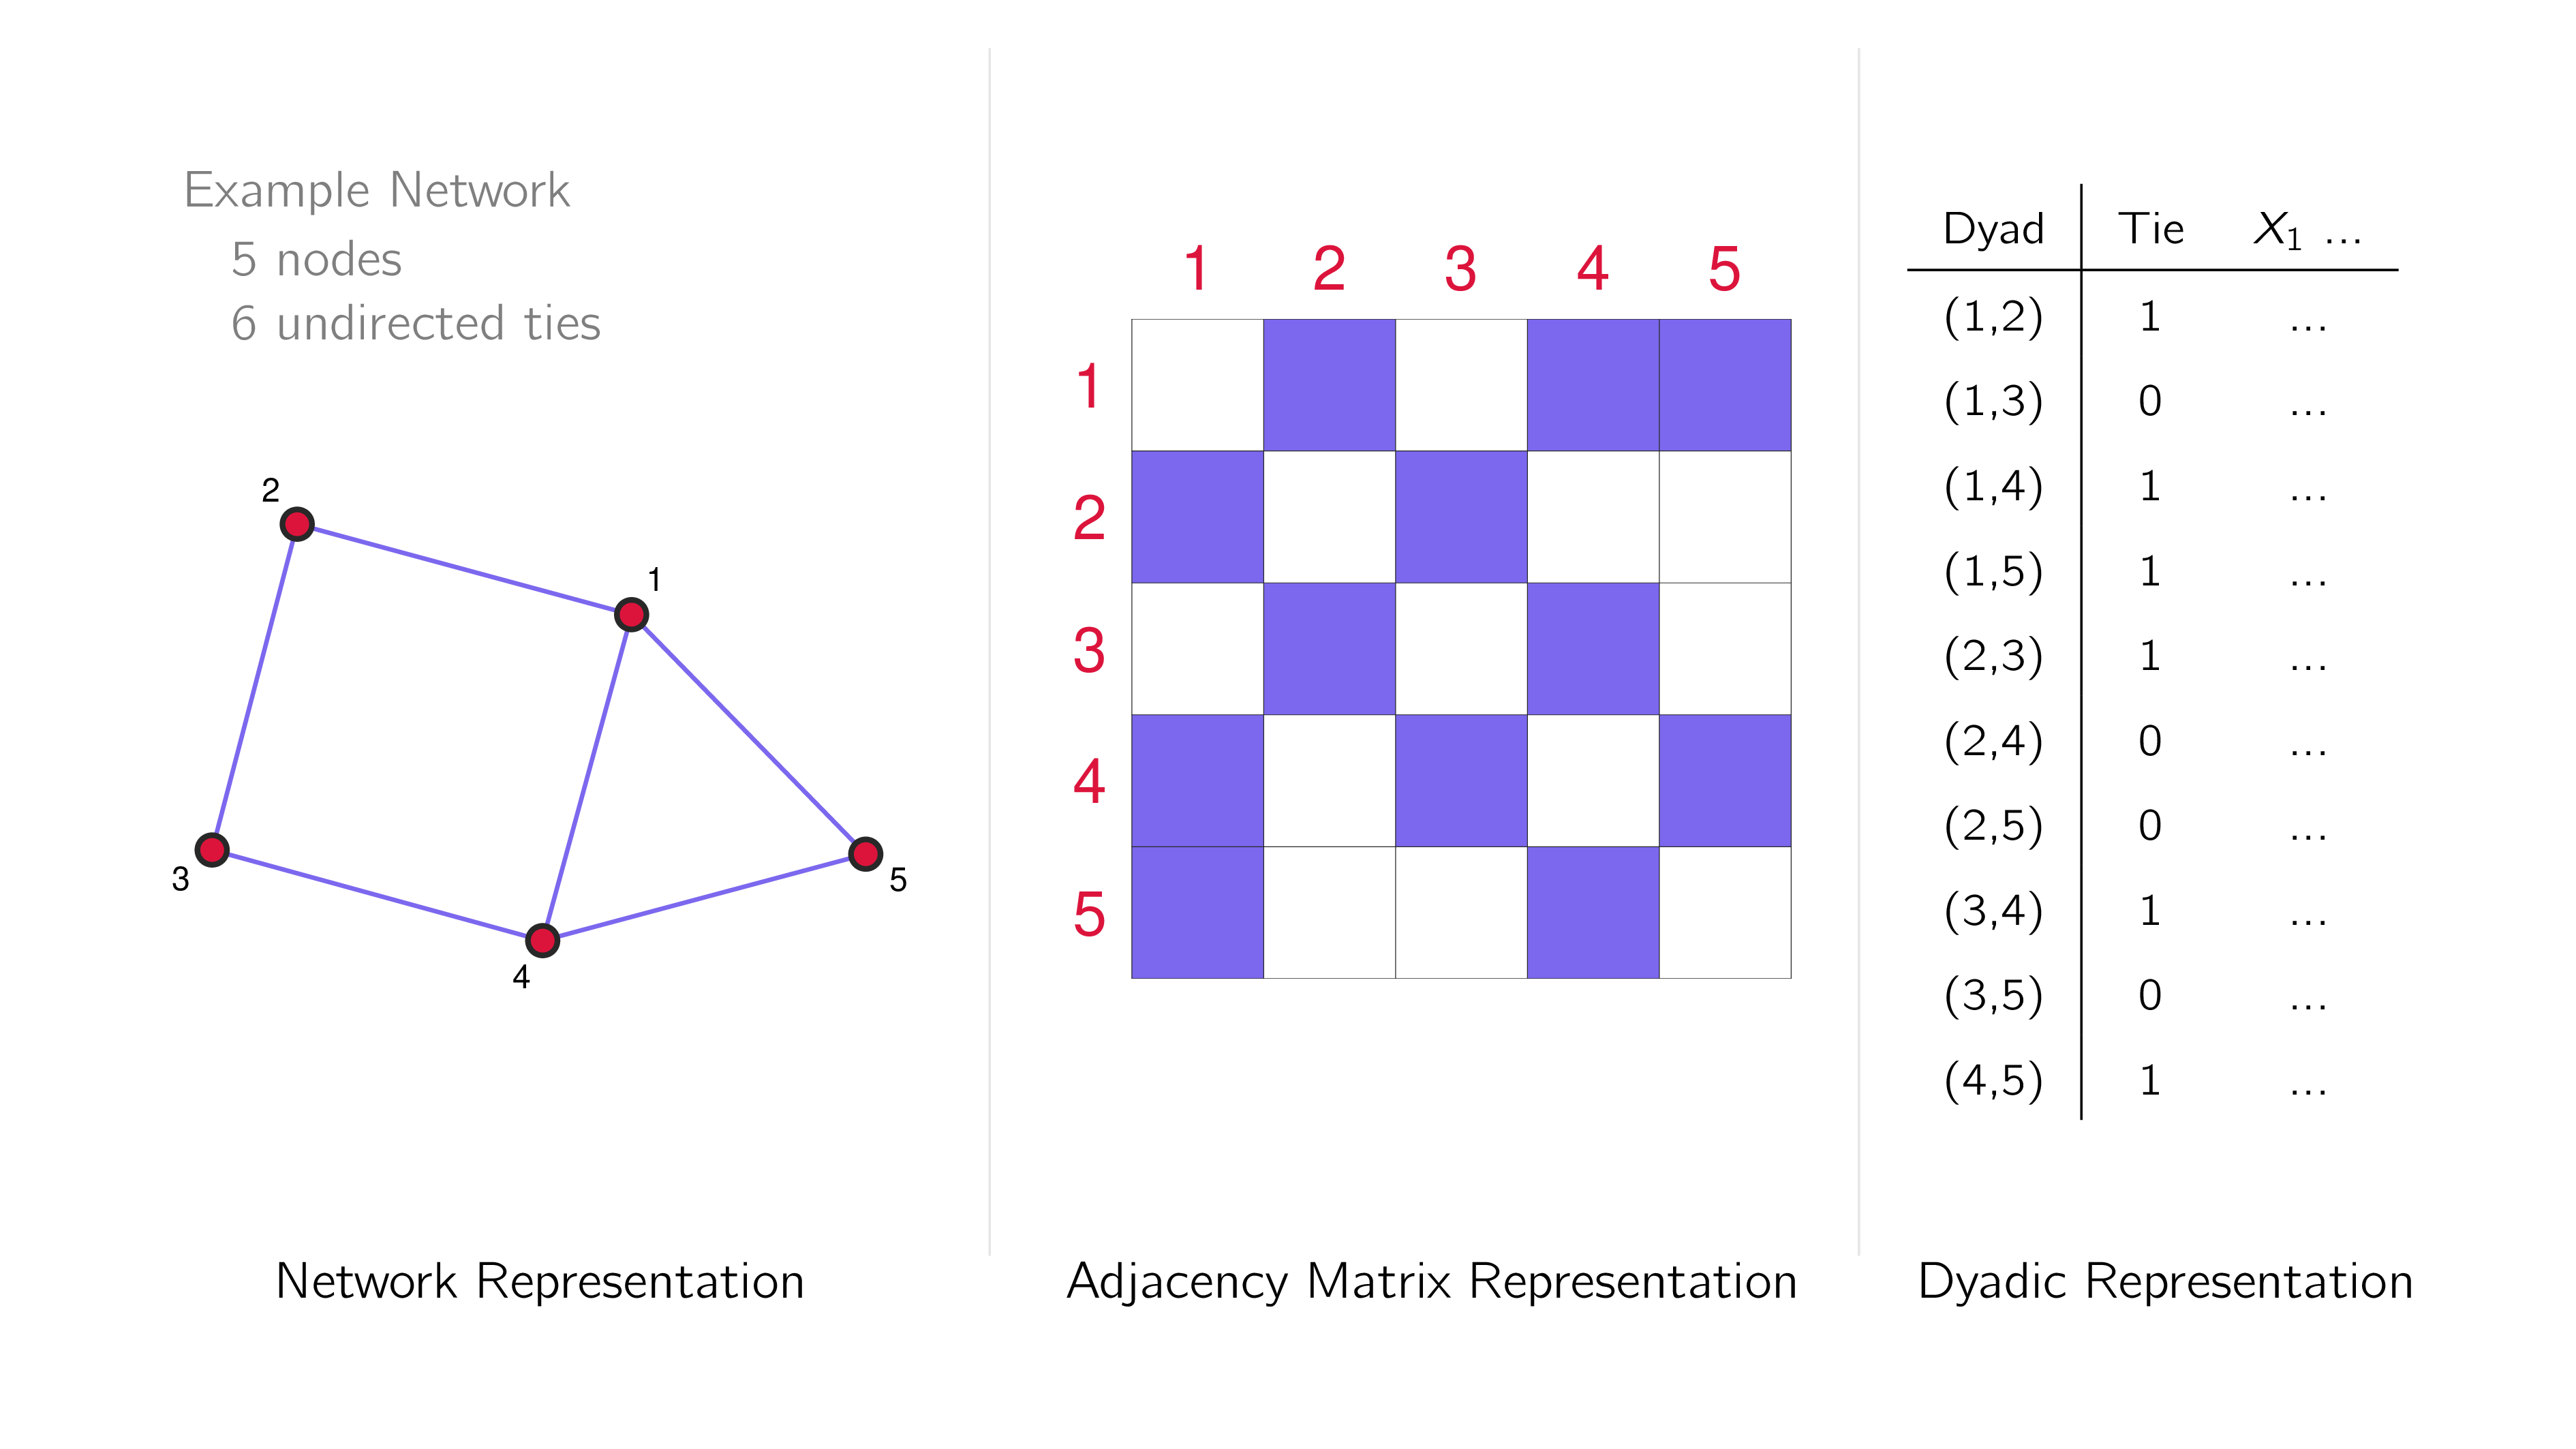
The ERGM can be expressed in two ways:
As a network:
$$Pr(\boldsymbol{G},\boldsymbol{\theta})=\kappa^{-1}\exp{\boldsymbol{\theta}’\boldsymbol{h}(\boldsymbol{G})}$$
As dyads:
$$Pr(G_{ij}|G,\mathbf{\theta})=logit^{-1}(\sum^k_{r=1}\theta_r\delta_r^{(ij)}(G))$$
| Representation | Relational Outcome | Generative Features |
|---|---|---|
| Network | $Pr(\boldsymbol{G},\boldsymbol{\theta})$ | $\boldsymbol{h}(\boldsymbol{G})$ |
| Dyad | $Pr(G_{ij}|G,\mathbf{\theta})$ | $\delta_r^{(ij)}(G)$ |
These are equivalent. Let’s go through each of the different components of the expressions with a focus on the “relational outcomes” and the “generative features”.
Relational Outcomes
These are our outcome variables. They are the conflicts, collaboration, citations, friendship, influence, or learning we want to study.
One of the important aspect of the ERGM is that it treats the set of outcomes as a multivariate distribution.
- This is how it deals with the interdependence between units problem
- This also means in some senses we only have one observation
- Assumption: The observed network is the expected outcome given the model (this is similar to the assumption from classical regression that the observed values in a data set is representative of the population)

Generative features
Generative features are factors/effects/variables that contribute to the formation of a tie on the network.
In ERGMs, they are specified as local network configurations.
network: total count over the network
- $\boldsymbol{h}(\boldsymbol{G})$
dyad: number of configurations the dyad contributes to/is a part of
- $\delta_r^{(ij)}$
They are the observable manifestations of tie combinations given your theorized social process.
- ERGMs are generative models, meaning that it can be used to simulate the systems that share the (modelled) generative features of the observed system.
- Assumption: networks with the same counts of local network configurations in the specified model will have equal probability of being observed (this is equivalent to the assumption from classifical regression analysis that there are no omitted variables - we have properly captured the generative process in our model)
Exogenous covariates
ERGMs can include actor- and dyad-level factors just like the traditional logistic regression.
For example:
- node: democratic regimes
- dyad: joint-democracy
Endogeneous effects
Endogeneous effects are generative features that go beyond the dyad. The are commonly called “network effects.”
- network: more than one dyad (or directed dyad) involved in the social process.
- dyad: more than nodes i and j matter to what happens between i and j.

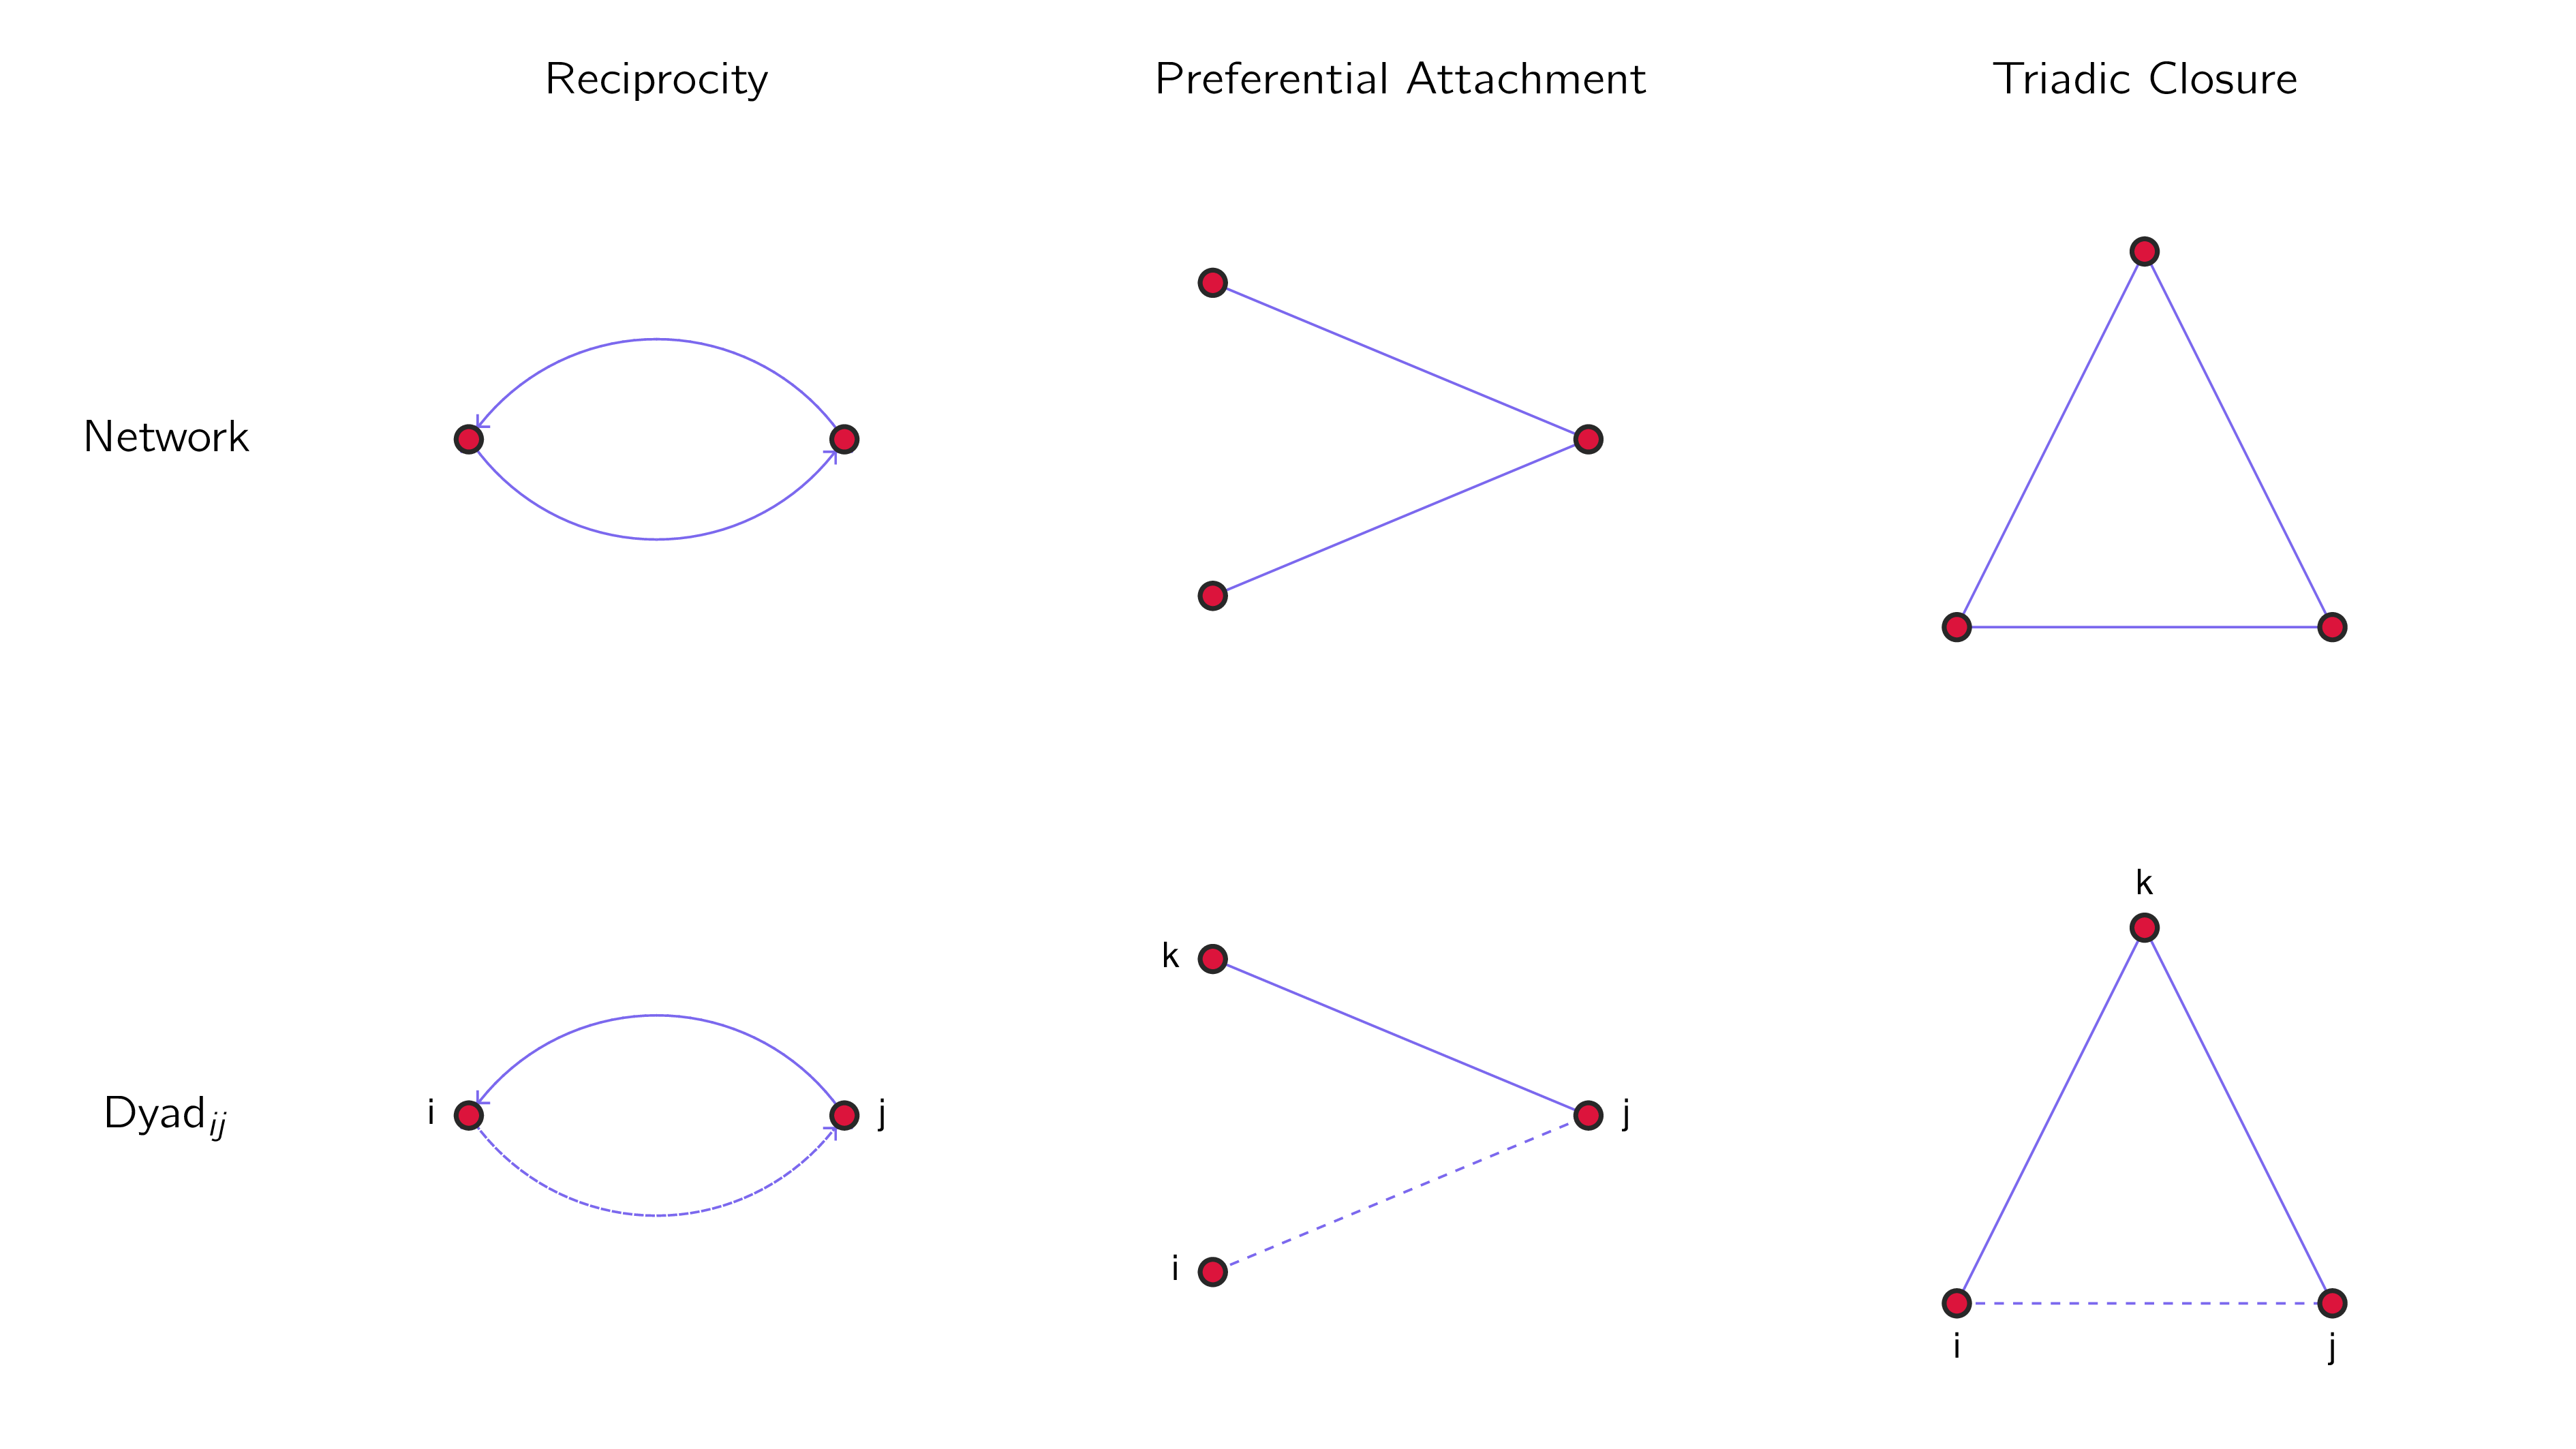
Reciprocity
If $j \rightarrow i$, then $i \rightarrow j$
Are actors likely to reciprocate ties? (Only works for directed networks.)
Preferential Attachment
If $j–k$, then $i–j$
Are actors with more ties more likely to get even more ties?
Triadic Closure
If $i–k$ and $j–k$, then $i–j$
Are actors with shared partners more likely to form a tie?
Summary of some common network effects
| Network Effect | Local Network Configuration |
|---|---|
| Preferential Attachment | k-star (usually 2) |
| Reciprocity | Reciprocal ties on the dyad |
| Triadic Closure | Triangles |
Conditional network effects
These are effectively interaction terms between local network configurations and exogeneous covariates.
For example, We can also have conditional triadic closure.
- we only consider triangles (i.e. local network configurations) if they comprise democracies